Virginia Tech Recruiting 2013
Sphere of Influence has been attending various career fairs at Virginia Tech for the last several years, looking for the best and brightest students to hire as interns and future full time employees. We’ve found it difficult, however, to shape an interview process appropriate for students at various stages in their education. This year we decided to do something to help fix that.
Back in late July, about a month and a half before the event, I came up with the idea of trying to gather data on what technologies Virginia Tech students were being exposed to during their education, as well as their level of comfort with these technologies. We’d tried to modify our interview process based on information available on the computer science department’s website,but found that by focusing mainly on coursework the interviews quickly became repetitive with little to distinguish between the students. After all, every student had taken the required Data Structures and Algorithms course, implemented a Quadtree data structure and mapped out efficient bus routes for the same project.
We needed to find a way to differentiate between candidates, to find which questions actually mattered in the interview, the questions that separated the good from the great.
We needed data.
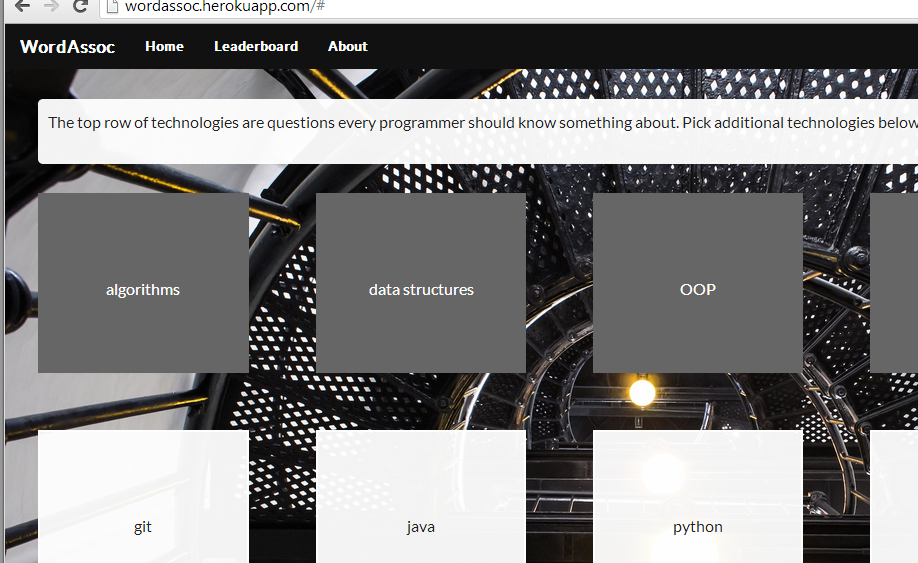
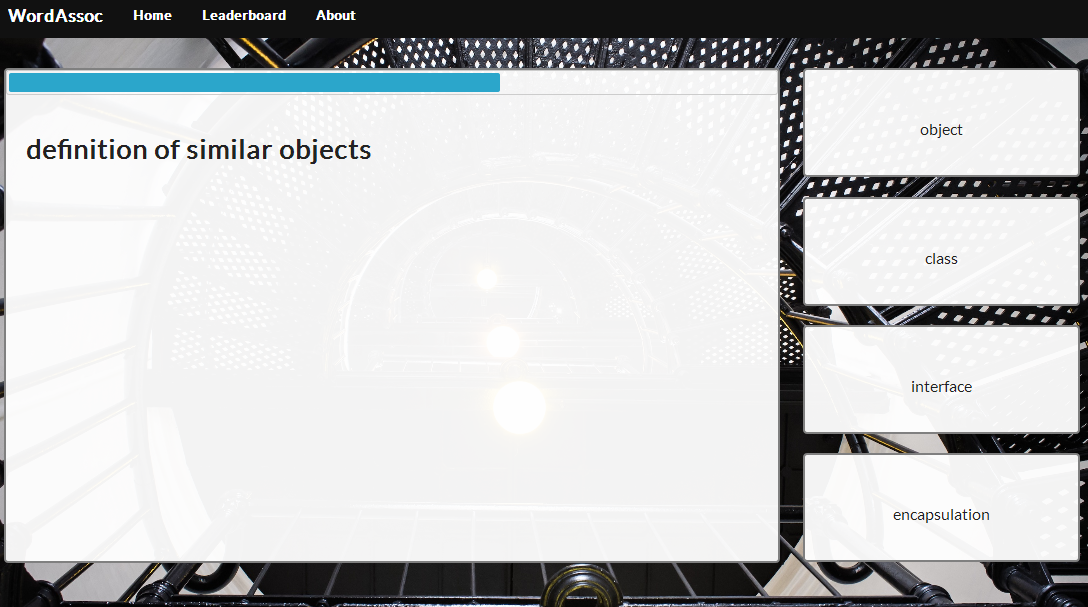
So I decided to create a game for students to play while waiting to talk to us at the recruiting event. To keep the game fast paced and interesting (as well as to gather as much data as possible), we decided to go with a word association game. The format of the game is simple. Students select what technologies they know from a preselected list of technologies the students might be familiar with that SOI is interested in. The system then selects from key terms and phrases associated with the technologies the user selected and generates answers based on the type of term asked. The user’s job, then, is to select which technology the term is associated with.
In addition to phrases tied to specific technologies, we included several phrases we’d expect candidates to recognize, from topics like Object-Oriented Programming, data structures, algorithm analysis, and basic programming terms. Together with the user-selected technologies, this strategy ensured that users would get a customized game experience with a variety of questions across several topics.
Due to the relatively short development time (about 40 hours total of work, spread across weekends and spare time during the week) I chose to go with a language I knew well, Python, and a relatively light web framework called Flask for the backend. The majority of the logic for interaction during game play occurs entirely on the client, written in JavaScript, to avoid the overhead of constant network traffic. The whole thing was hosted on Heroku, a cloud-based Platform as a Service (PaaS) provider, with a PostgreSQL database to persist the results.
This was my first time using Heroku (or any PaaS provider) for anything more than a toy application or tutorial, and I have to say I was impressed by how easy it was to set up and use. Deploying to Heroku was as easy as adding the database URL to the Flask config, pushing my code to a special repository, and refreshing the page! After a few minutes more of fiddling I was able to configure Flask to fall back to using a SQLite3 database on my local machine for testing so I didn’t have to install Postgres. At the end of the month it cost me all of $5.59 to host the application for a month. Of that, $4.65 was a flat fee for using their hosted Postgres installation and the rest was from usage, mainly occurring on the day of the event. Well worth it to avoid the hassle of setting up my own server!
But what good is a game without motivation, though? Each question the player answered correctly contributed to their overall score, while wrong answers counted against them. At the end of the day, the player with the highest score won an iPad mini; the same device that they were using to play the game on! In addition, every player is able to view the source for the game, an anonymized result dataset, and any analysis we’ve done on the data. Here’s a peek at some of the results we found:

I chose to do the analysis in an interactive Python session using the Numpy and Matplotlib libraries. I saved off the various data as JSON and used the fantastic JavaScript library D3.js to generate SVG files for the custom visualizations. Finally, I imported the visualizations into the Inkscape SVG editor to lay them out, provide contextual information, and style everything. I would have liked to dig deeper into the data and pull out a few more statistics to drive the visualization further, but this was my first infographic and so my progress was a little slow, and I wanted to get this out since we’re now a month past the event and starting to do interviews.
Most of the data in the infographic is relatively basic: statistics on accuracy broken down by various question categories, technologies, that kind of thing. There were two results that I found very interesting.
The first was how much phrasing the question mattered. In one of the question categories, students were asked to associate a real-life scenario with the data structure that best represents it. The scenarios associated with a HashMap were a dictionary, a phone book, and an index. Students were much more likely to associate a dictionary or phone book with the Map data structure than an index. This is something that psychologists and statisticians have long understood, but it was striking to see such a blatant example in the result data.
The second interesting result was the list of question topics we generated at the bottom of the infographic. Recall that the point of this exercise was to gather data to help us improve our interview process for college students. I took the approximately 500 questions the students answered, calculated the average accuracy by question, and sorted them by that accuracy value. My intuition for selecting topics was similar to performing binary search.
Given the full pool of candidates, we’d like to ask a question that approximately divides the candidates in half, that is, a question with around 50% accuracy. We then ask the successful candidates another question with a close to 50% accuracy, further subdividing the pool of potential candidates. We keep performing this process until we reach a reasonably sized pool of candidates to interview.
This of course assumes that the ideal candidate would correctly answer every question we asked, and that set potential candidates still has around a 50% chance to correctly answer the next questions at every stage, which is absurd. Asking a question about generators, a key concept in Python programming, to a programmer who’s only ever used C# and C++ would be a little unfair. So, instead of eliminating candidates at each step we average their results across the various steps, with the idea that the ideal candidate should be able to answer most of the questions correctly.


